- Farm Management
- Software
- Data management software
- www.i-grain.net
Monitoring software Matrixdata managementplantfor sensors
Add to favorites
Compare this product
Characteristics
- Function
- monitoring, data management
- Applications
- plant, for sensors
Description
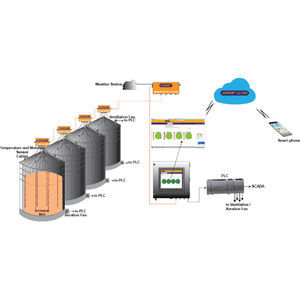
Via the Matrix view, you have an easy and comprehensive overview of all sensory readings from your iGRAIN monitoring system. Depending on the configuration of your iGRAIN System this may include data read out of; temperature, moisture, Co2, inventory, and aeration status.
The Matrix View displays all silos in your plant, and it will also give you an overview of the sensory reading of all sensor cables grouped silo by silo. This includes a display of the highest and the lowest temperature reading for each silo and cable, and an indication of the functioning of all sensors.
In the Trend Curve view, the highest and the lowest temperature readings in each silo and the average reading of all temperature sensors is shown. If Moisture Sensor Cables are installed in the silo, it will be possible to display the trend curve for the average grain moisture. Likewise, if CO2 sensors are installed it will be possible to display the curve for the CO2 level in the silos, this is called the ”spoilage indication” curve.
You can freely select the measurement time span (from date and to date) and the data resolution as: daily average, hourly average or 5 min average. This allows close scrutiny of any data recorded.
Catalogs
Silo monitoring systems
1 Pages
Exhibitions
Meet this supplier at the following exhibition(s):
*Prices are pre-tax. They exclude delivery charges and customs duties and do not include additional charges for installation or activation options. Prices are indicative only and may vary by country, with changes to the cost of raw materials and exchange rates.


